Profiling Go Applications with Flamegraphs
Application performance issues are, by their very nature, unexpected - and always seem to rear their heads at the worst possible time. To make matters worse, many profiling tools are cold, convoluted, and downright confusing to use - taking user experience cues from fan favorites such as valgrind and gdp.
Flamegraphs, a tool invented by linux perf guru Brendan Gegg, bring some “warmth” to the complicated process of identifying and fixing performance issues by generating an SVG visualization layer on top of a normal linux performance trace dump. In this post, we will walk though the process of profiling a basic golang web application to by using flamegraphs
A quick aside before we begin
You should only profile and optimize your program if you know that you have a performance problem before you begin profiling. Otherwise, premature optimization is not only a waste of your immediate time, but it will also slow you down in the future if you have to refactor your brittle and finely-tuned code.
Our sample program
We are going to be working with a small HTTP server which exposes a simple healthcheck API via GET /ping. For visibility, we have also included a small statsd client which records the latency of each request handled by the server. For simplicity, our code only is using the go stdlib but it should not seem too foreign you are used to using gorilla/mux or another popular library.
import (
    "fmt"
    "log"
    "net/http"
    "strings"
    "net"
    "time"
)

// SimpleClient is a thin statsd client.
type SimpleClient struct {
    c net.PacketConn
    ra *net.UDPAddr
}

// NewSimpleClient instantiates a new SimpleClient instance which binds
// to the provided UDP address.
func NewSimpleClient(addr string) (*SimpleClient, error){
    c, err := net.ListenPacket("udp", ":0")
    if err != nil {
        return nil, err
    }

    ra, err := net.ResolveUDPAddr("udp", addr)
    if err != nil {
        c.Close()
        return nil, err
    }

    return &SimpleClient{
        c:  c,
        ra: ra,
    }, nil
}

// Timing sends a statsd timing call.
func (sc *SimpleClient) Timing(s string, d time.Duration, sampleRate float64,
    tags map[string]string) error {
    return sc.send(fmtStatStr(
        fmt.Sprintf("%s:%d|ms",s, d/ time.Millisecond), tags),
    )
}

func (sc *SimpleClient) send(s string) error {
    _, err := sc.c.(*net.UDPConn).WriteToUDP([]byte(s), sc.ra)
    if err != nil {
        return err
    }

    return  nil
}

func fmtStatStr(stat string, tags map[string]string) string {
    parts := []string{}
    for k, v := range tags {
        if v != "" {
            parts = append(parts, fmt.Sprintf("%s:%s", k, v))
        }
    }

    return fmt.Sprintf("%s|%s", stat, strings.Join(parts, ","))
}

func main() {
    stats, err := NewSimpleClient("localhost:6060")
    if err != nil {
        log.Fatal("could not start stas client: ", err)
    }

    // add handlers to default mux
    http.HandleFunc("/ping", pingHandler(stats))

    s := &http.Server{
        Addr:    ":8080",
    }

    log.Fatal(s.ListenAndServe())
}

func pingHandler(s *SimpleClient) http.HandlerFunc{
    return func(w http.ResponseWriter, r *http.Request) {
        st := time.Now()
        defer func() {
            _ = s.Timing("http.ping", time.Since(st), 1.0, nil)
        }()

        w.WriteHeader(200)
    }}
Installing Profiling Tools
The go stdlib comes with “batteries included” diagnosing performance issues, and there is a rich ecosystem of tools which can hook into go’s simple, efficient, runtime. If you are using the default http.DefaultServeMux for your application, integrating pprof should require no more code than adding the following statement to your import header:
import (
  _ "net/http/pprof"
)
You can verify that you setup everything correctly by starting up the server and visiting
/debug/pprof in any web browser. For our example application - the pprof interface is exposed
at localhost:8080/debug/pprof.
Generating a Flamegraph
The flamegraph tool works by taking an existing stack trace file from your system and parsing it to produce a SVG visualization. To make one of these elusive stack trace files, we can use the pprof tool which ships with your go installation. To tie things together and save us the pain of installing and configuring any more software, we will use the excellent uber/go-torch library – which provides an convenient containerized workflow for this entire process.
Flamegraphs can be generated from a variety of profiles, each targeting a different performance attribute. You can use the same toolbox and methodolgy to hunt down CPU bottlenecks, memory leaks, and even deadlocked processes.
To generate a flamegraph for our application, run the following command to grab the uber/go-torch container and point it at your application.
# run for 30 seconds
docker run uber/go-torch -u http://<host ip>:8080/debug/pprof -p -t=30 > torch.svg
Generating Request Load
If your application server is running locally, or is sitting in a staging environment, it may be difficult to replicate the scenario which is causing your performance problems in the first place. As a means of simulating a production workload, we are going to use a tiny load-testing tool called vegeta to simulate a request throughput similar to what we are seeing each of our production servers handle.
vegeta has an incredibly powerful and configurable API for supporting various kinds of load testing and benchmarking scenarios. For our simple server and use-case, we can use the following one-liner to generate enough traffic to make things interesting.
# send 250rps for 60 seconds
echo "GET http://localhost:8080/ping" | vegeta attack -rate 250 -duration=60s | vegeta report
Running this script while also listening with the go-torch tool should produce a file called torch.svg. Open this file up in Chrome and you should be greeted by a nice flamegraph of your program!
open -a `Google Chrome` torch.svg
Reading Flamegraphs
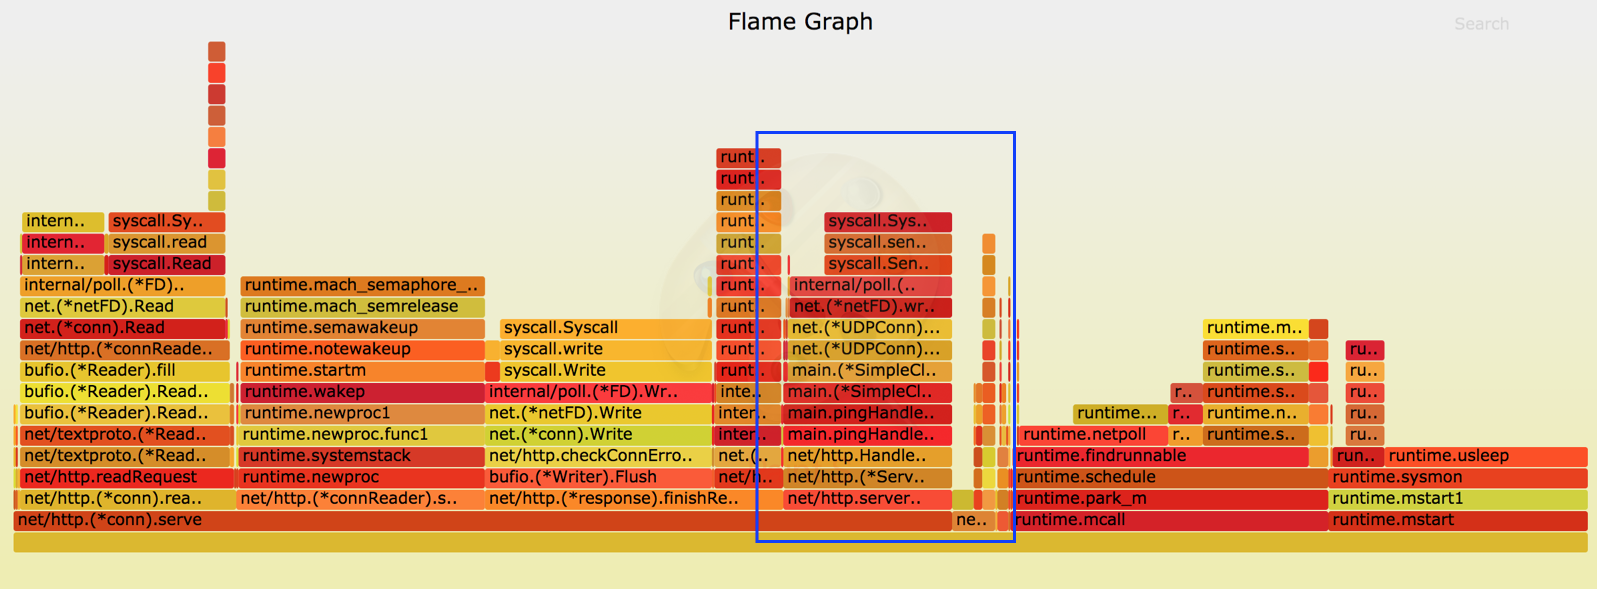
Each horizontal segment in the flamegraph represents a single stack frame, with its width determined by the relative (%) amount of time that your program was observed to be evaluating that frame during the sampling process. These segments are organized vertically into “flames” based on their position in the call-stack, meaning that those functions further up the y-axis are called by functions at the base of the graph - and inherently are responsible for a smaller slice of CPU-time. If you want to dive deeper into one part of the visualization you can simply click on a frame and all frames below it will disappear and the UI will resize itself.
N.B. The color of each stack frame is insignificant and is completely random - differences in tone and intensity are provided only as a means to make the diagram easier to read.
Upon immediate inspection or after clicking on a few frames to narrow down your scope - it should become immediately obvious if you have a performance problem and what is it. Remember the 80/20 rule, most of you performance issues will come from a small segment of your code doing way more work than it should be - don’t spend your time chasing small, thin, spikes on the flamegraph chart.
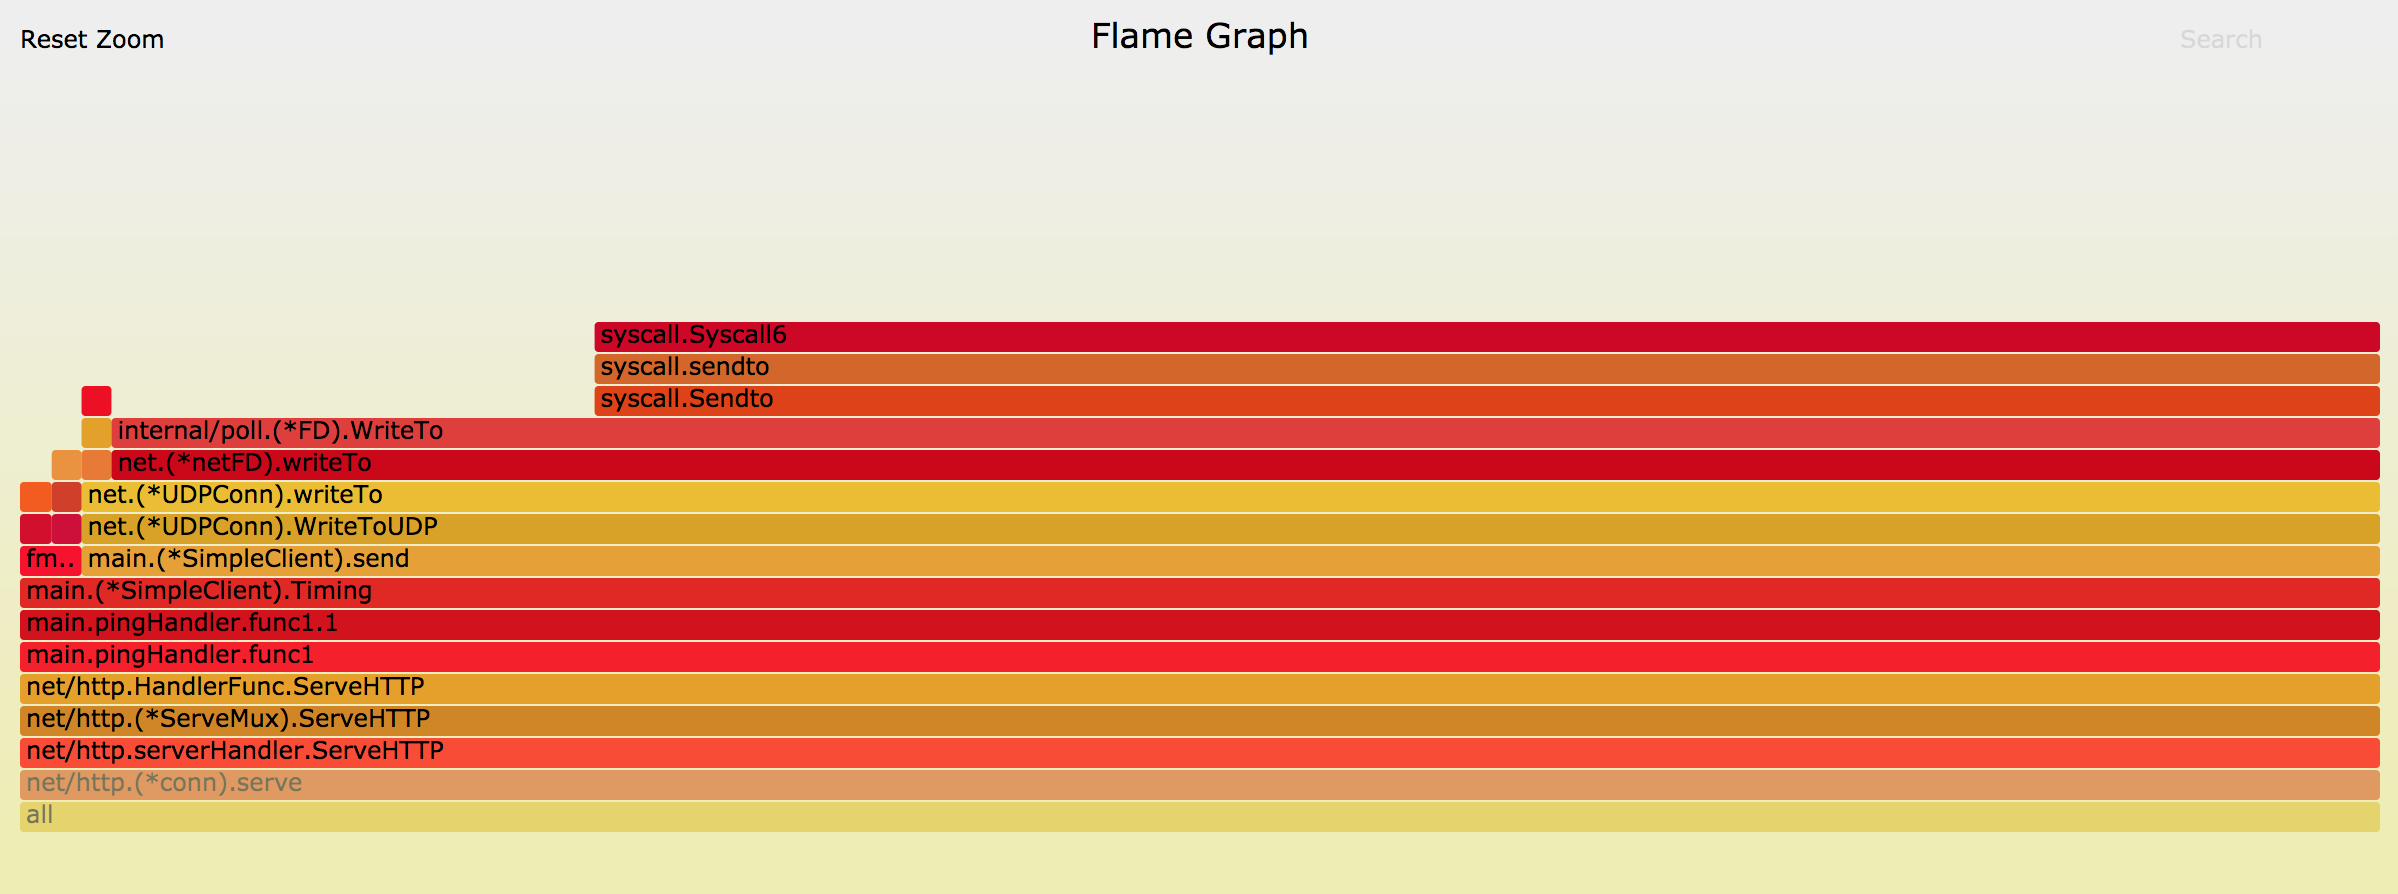
For instance, in our program we can dive into one of the larger slices and see that we are spending roughly 10% (!) of our time flushing results over a network socket in our statter! Luckily, fixing this is simple - by adding a small buffer to our code, we are able to clean up this issue and produce a new, slimmer graph.
Code Change
func (sc *SimpleClient) send(s string) error {
    sc.buffer = append(sc.buffer, s)
    if len(sc.buffer) > bufferCapacity {

        b := strings.Join(sc.buffer, ",")
        _, err := sc.c.(*net.UDPConn).WriteToUDP([]byte(b), sc.ra)
        if err != nil {
            return err
        }

        sc.buffer = nil
    }

    return  nil
}
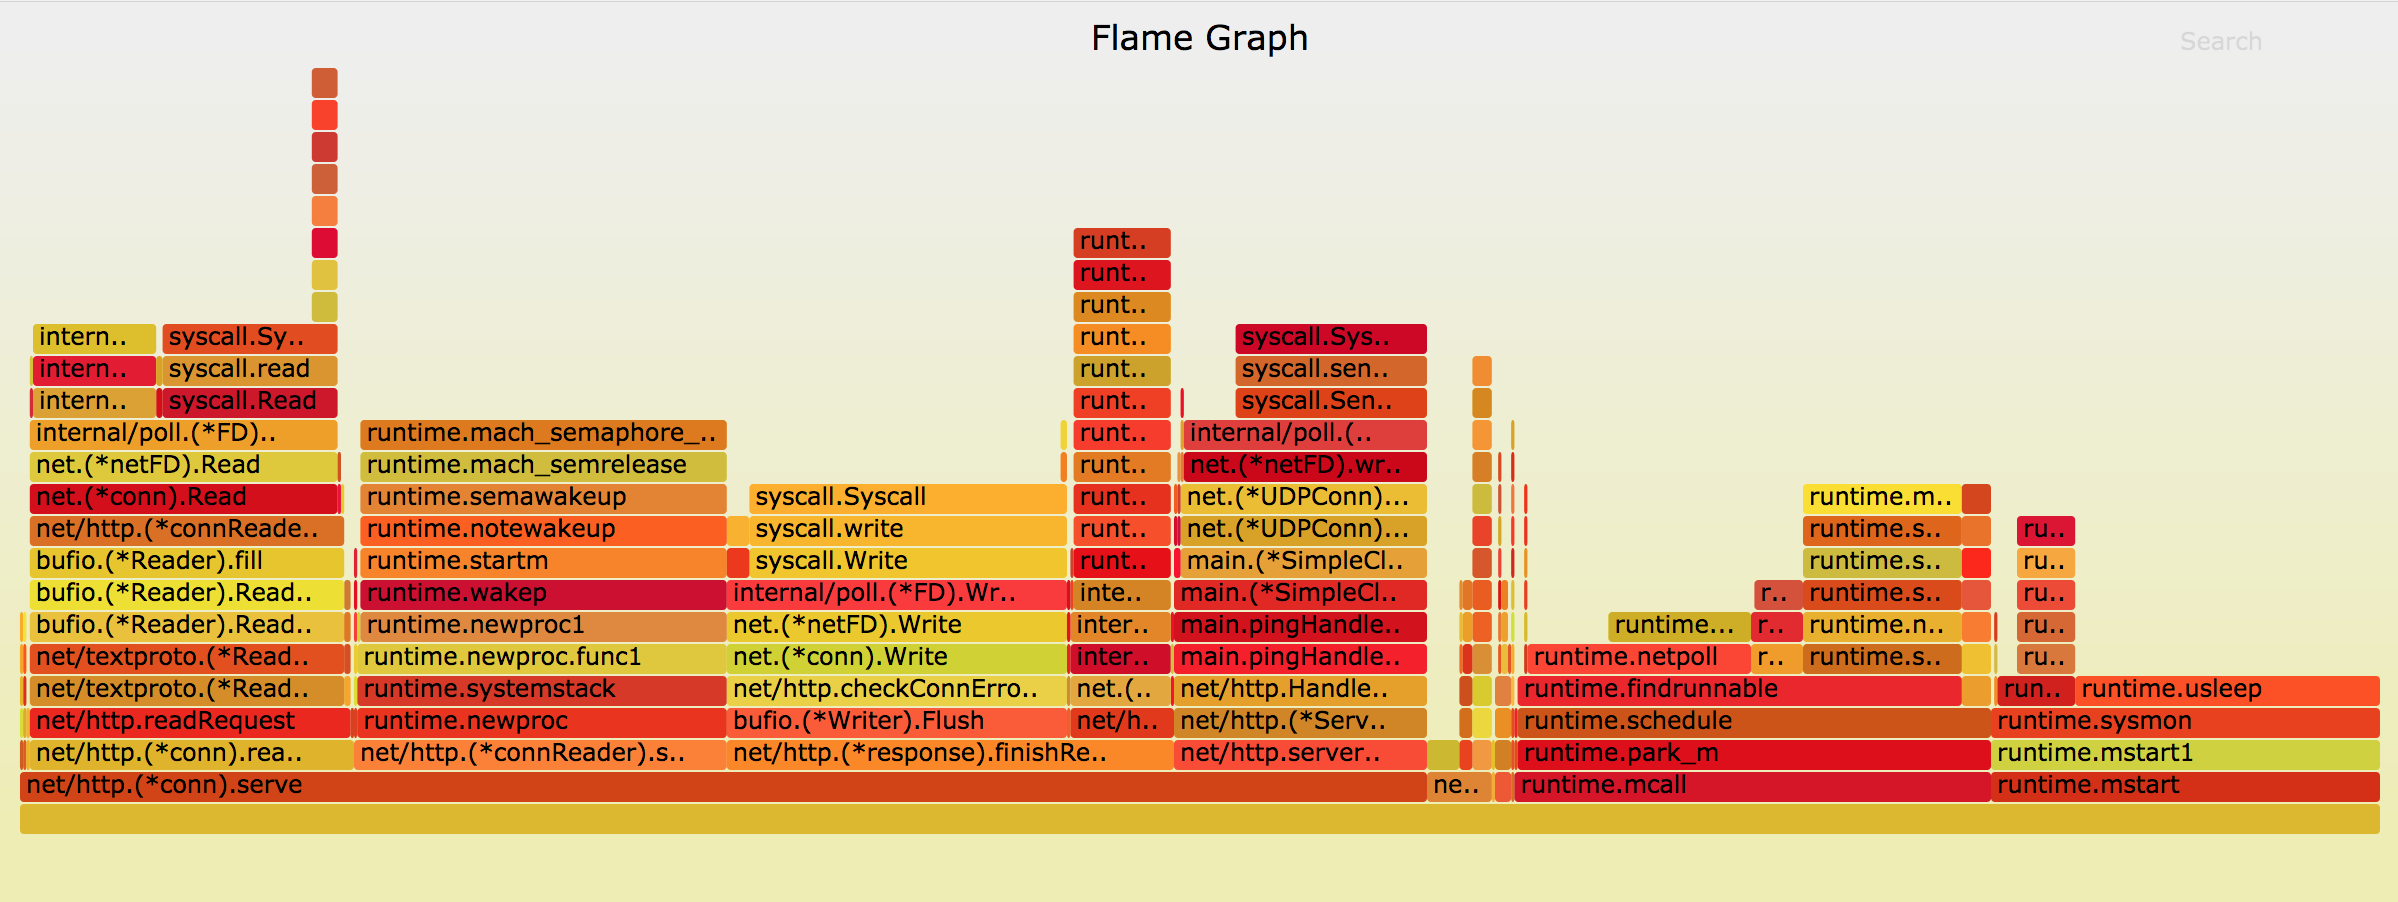
New flamegraph
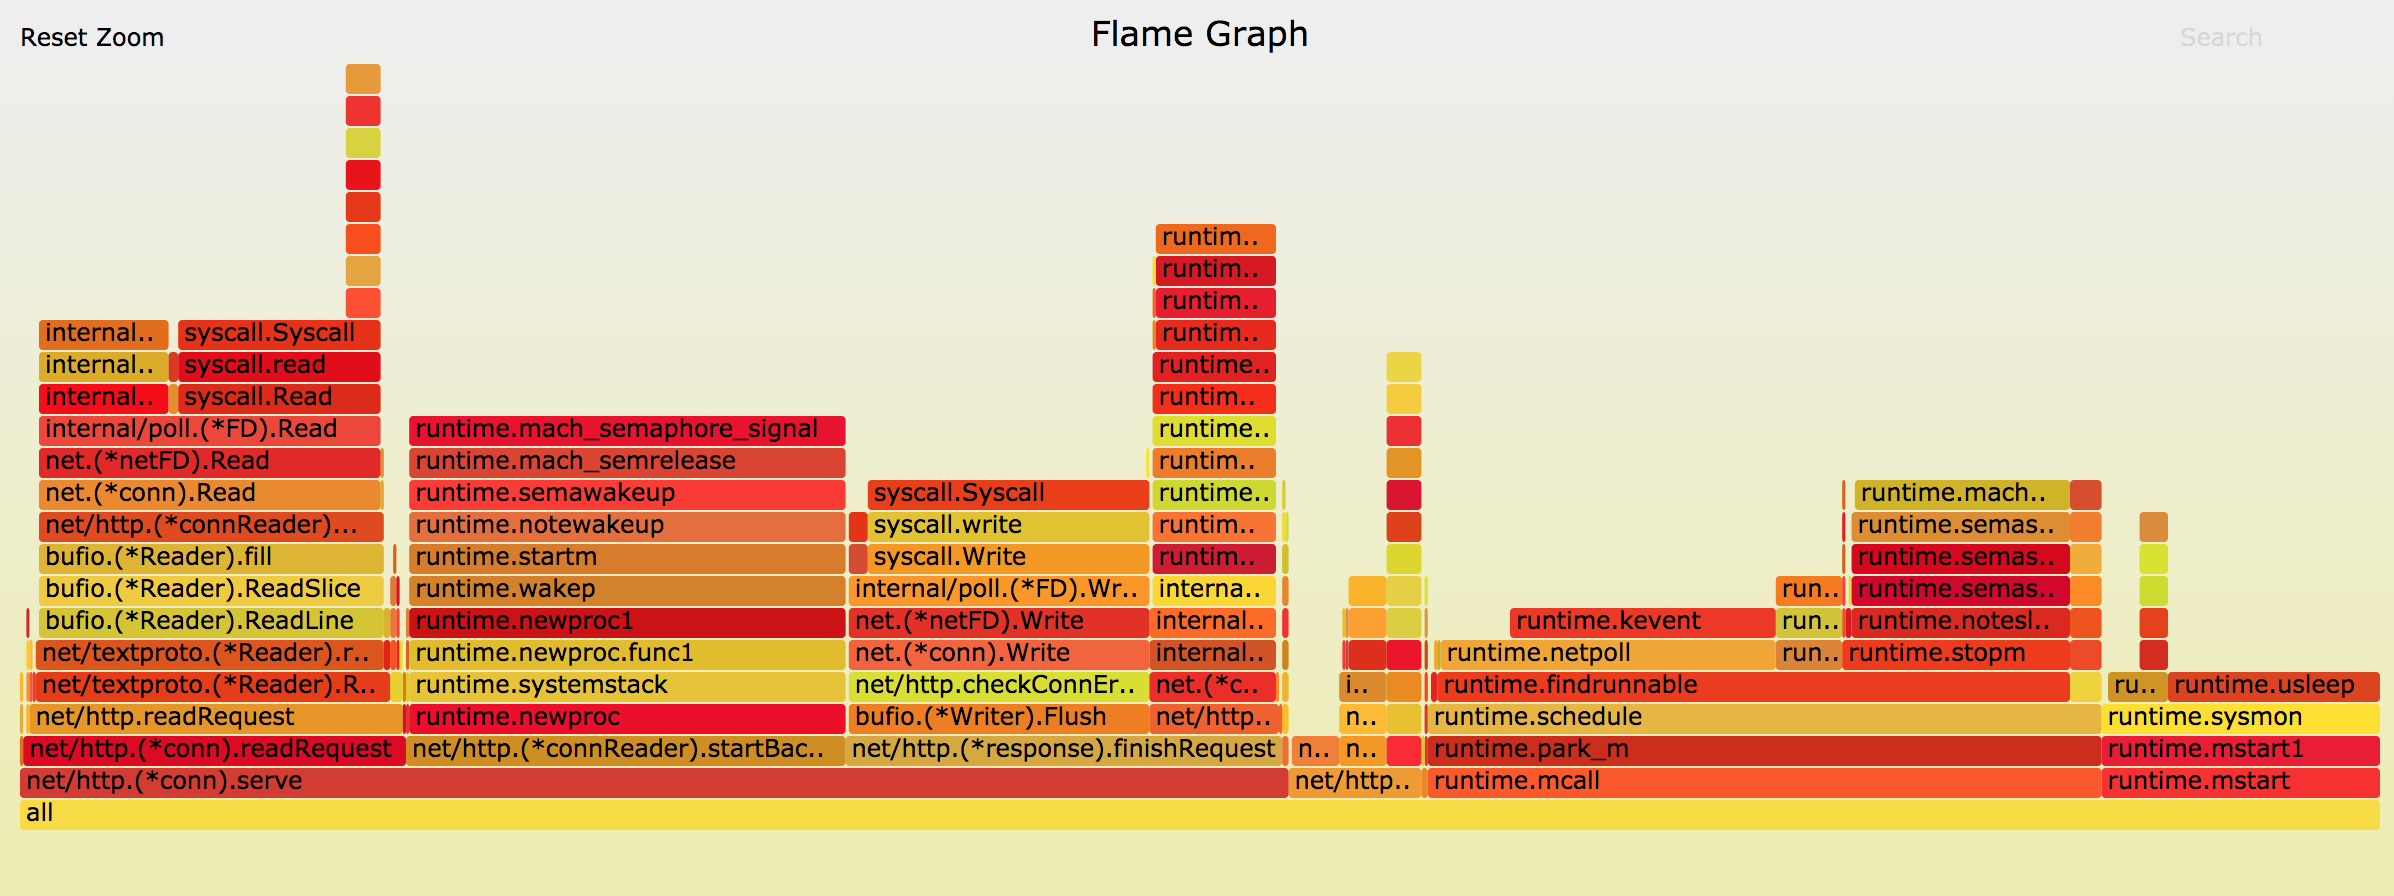
That’s it! Flamegraphs are a simple and powerful tool for peeking inside your application’s performance. Try generating a flamegraph of one of your applications - you may be surprised what you with what you find :)
Further Readings
Want to learn more? Here are a few great links: